1QFY2020 Result Update | Luggage
August 19, 2019
Safari Industries
BUY
CMP
`553
Performance Update
Target Price
`646
Y/E March (` cr)
1QFY20 2QFY19
% yoy
4QFY19
% qoq
Investment Period
12 months
Net sales
203
157
29.1
141
44.5
EBITDA
21
22
(4.9)
8
163.0
Stock Info
EBITDA margin (%)
Sector
Luggage
10.2
13.8
(364bp)
5.6
459bp
Market Cap (` cr)
1,236
Adjusted PAT
9
12
(29.2)
4
133.6
Net Debt (` cr)
41
Source: Company, Angel Research
Beta
0.7
For 1QFY2020, Safari Industries (SIL) posted Strong Result top-line growth, though
52 Week High / Low
1005/481
Avg. Daily Volume
3,823
it disappointed on bottom-line front. Revenue grew ~29% yoy to `203cr. On the
Face Value (`)
2
margin front, the company reported operating margin contracted by 364bps yoy.
BSE Sensex
37,624
On the bottom-line front, SIL reported de-growth of ~29% yoy to ~`9cr due to cost
Nifty
11,120
pressures.
Reuters Code
SAFA.BO
Bloomberg Code
SII.IN
Strong volumes boost overall top-line growth: The Company’s top-line grew by
~29% yoy to `203cr on the back of strong volume growth (market share gain from
Shareholding Pattern (%)
unorganized player).
Promoters
57.6
MF / Banks / Indian Fls
0.0
Poor operating performance impacted the overall profitability: On the operating
FII / NRIs / OCBs
9.9
margin front, the company reported margin contraction by 364bps yoy due to cost
Indian Public / Others
32.5
pressure.
Outlook and Valuation: Going ahead, we expect SIL to report a top-line CAGR of
Abs. (%)
3m
1yr 3yr
~19% over FY18-20E to ~`813cr on the back of diversified product portfolio
Sensex
(0.1)
(0.8)
33.1
(catering to customers from all segments), and strong distribution network with high
SIL
(12.5)
(34.9)
90.5
brand recall. Moreover, we believe that SIL’s bottom-line is set to grow at a CAGR
of ~23% over FY18-20E due to gradual improvement in operating margin. We
maintain our Buy recommendation on the stock with a Target Price of `646.
Key Financials
Y/E March (` cr)
FY2018
FY2019
FY2020E FY2021E
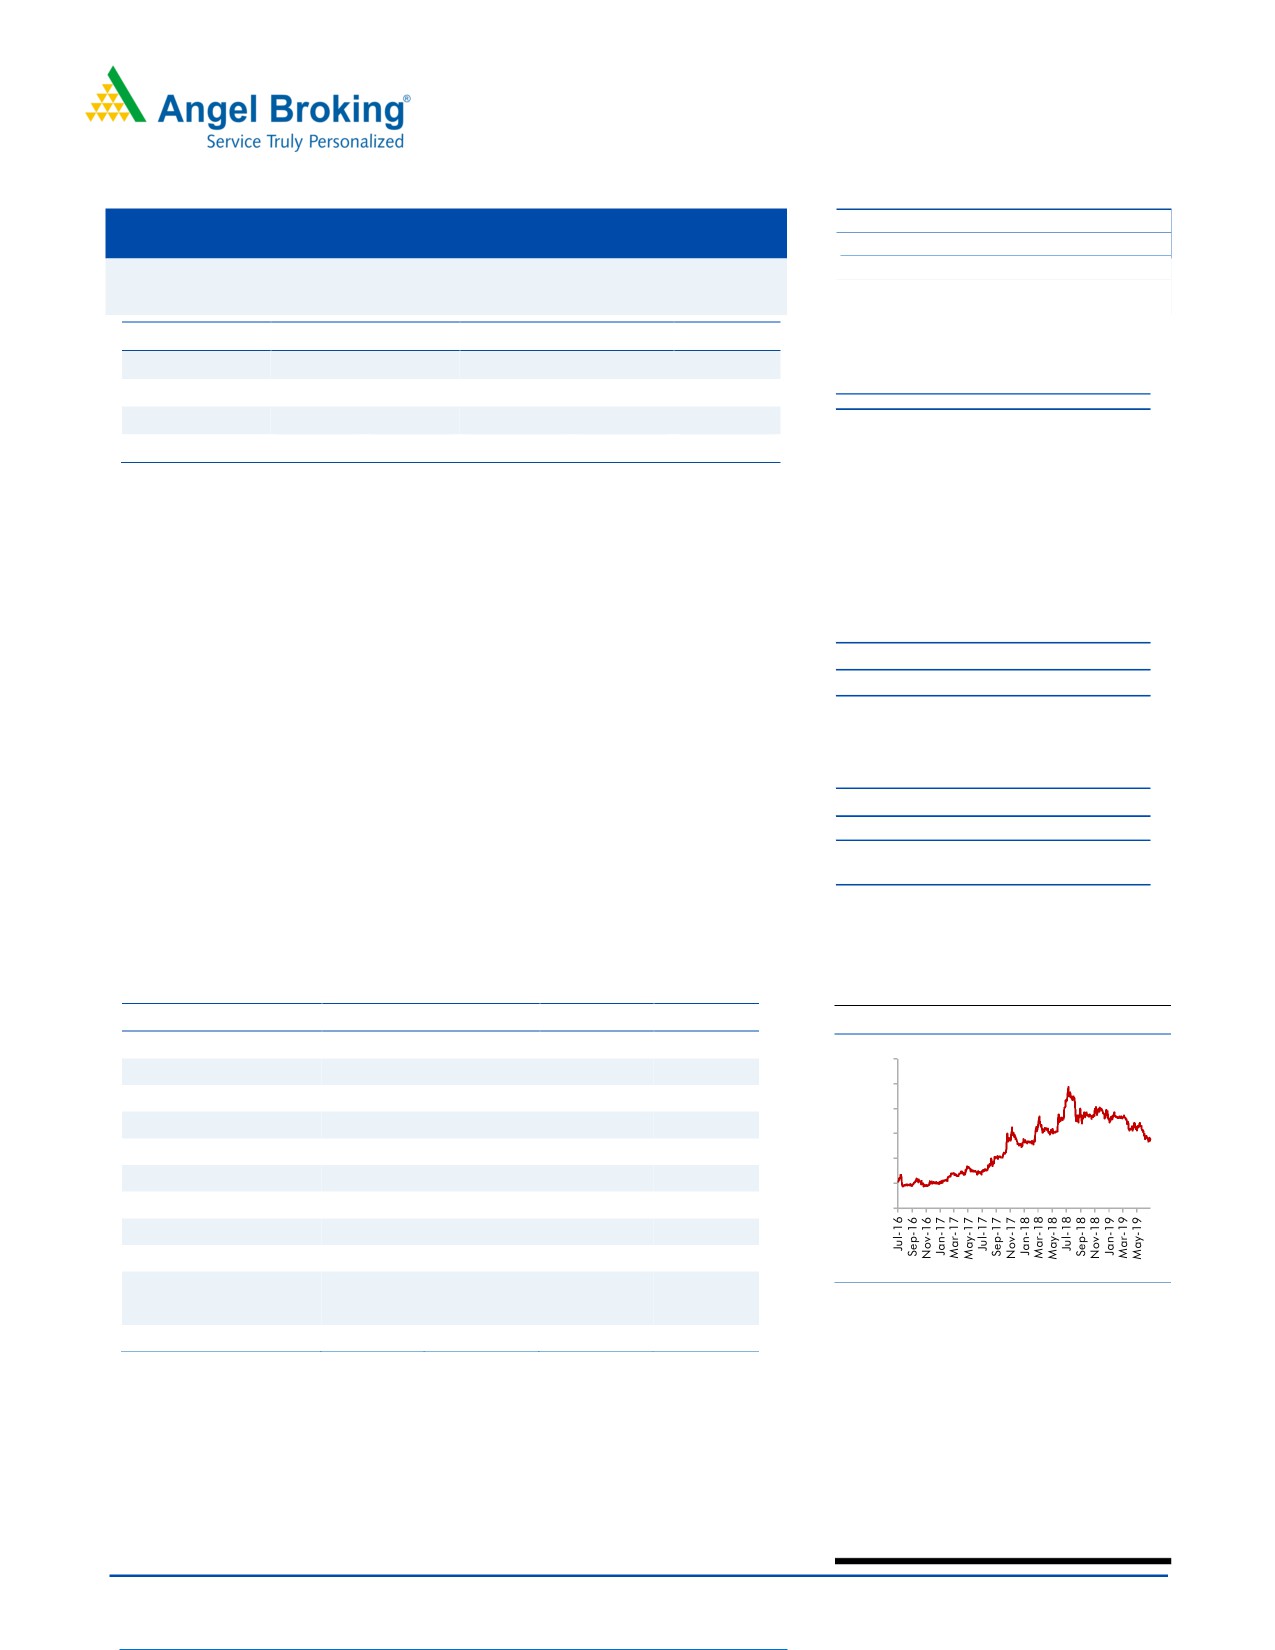
Price Chart
Net sales
415
578
702
813
1200
% chg
15.8
39.1
21.6
15.8
1000
Adj. Net profit
21.2
27.2
33.1
41.1
800
% chg
103.3
28.3
21.4
24.2
600
EBITDA margin (%)
9.8
9.1
11.1
11.3
400
EPS (`)
9.5
12.2
14.9
18.5
200
P/E (x)
57.0
44.5
36.6
29.5
0
P/BV (x)
9.6
8.4
7.3
6.3
RoE (%)
12.3
13.8
14.5
15.5
RoCE (%)
15.2
17.3
20.3
21.5
Source: Company, Angel Research
EV/Sales (x)
3.0
2.2
1.8
1.6
EV/EBITDA (x)
30.8
24.1
16.3
13.8
Research Analyst
Source: Company, Angel Research Note
Amarjeet S Maurya
022-40003600 Ext: 6831
Please refer to important disclosures at the end of this report
1
Safari Industries|1QFY2020 Result Update
Exhibit 1: 1QFY20 Performance
Y/E March (` cr)
1QFY20
1QFY19
% yoy
4QFY19
% qoq
FY2019
FY2018
% chg
Net Sales
203
157
29.1
141
44.5
573
417
37.4
Consumption of RM
122
88
38.4
83
46.5
334
226
48.0
(% of Sales)
60.2
56.2
59.4
58.3
54.1
Staff Costs
19
16
23.8
17
14.6
65
53
23.4
(% of Sales)
9.6
10.0
12.1
11.4
12.7
Other Expenses
41
32
29.2
32
26.2
121
97
25.4
(% of Sales)
20.1
20.0
23.0
21.2
23.2
Total Expenditure
182
136
34.6
133
37.5
521
375
38.7
Operating Profit
21
22
(4.9)
8
163.0
52
41
25.3
OPM
10.2
13.8
5.6
9.1
9.9
Interest
3
1
181.6
2
68.6
4
3
54.7
Depreciation
5
2
153.4
2
143.2
8
6
33.0
Other Income
1
0
231.6
1
(25.0)
1
1
39.4
PBT (excl. Ext Items)
14
19
(28.6)
5
171.7
41
33
21.7
Ext (Income)/Expense
-
-
-
-
PBT (incl. Ext Items)
14
19
(28.6)
5
171.7
41
33
21.7
(% of Sales)
6.7
12.1
3.6
7.1
8.0
Provision for Taxation
5
7
(27.6)
1
280.0
14
12
12.2
(% of PBT)
36.4
35.9
26.1
33.5
36.4
Reported PAT
9
12
(29.2)
4
133.6
27
21
27.2
PATM
4.2
7.7
2.6
4.7
5.1
Minority Interest After NP
Reported PAT
9
12
(29.2)
3.7
133.6
27
21
27.2
Source: Company, Angel Research
August 19, 2019
2
Safari Industries|1QFY2020 Result Update
Downside risks to our estimates
Volatility in foreign currency could impact the company’s profitability ( most of its
revenue comes from soft luggage, which is imported from China).
With closure of many luggage units in China (owing to pollution concerns), the
surviving suppliers have started taking price hikes which could put pressure on its
margins, unless price hike is taken.
Increase in competition from unorganized players would impact overall growth of
the company
Safari’s 23% sales comes from hard luggage segment and any increase in input
cost (most of the key raw material is polypropylene and aluminum) could negatively
impact profitability
August 19, 2019
3
Safari Industries|1QFY2020 Result Update
Profit & Loss Statement
Y/E March (` cr)
FY2016 FY2017 FY2018 FY2019 FY2020E FY2021E
Total operating income
278
359
415
578
702
813
% chg
28.8
29.0
15.8
39.1
21.6
15.8
Total Expenditure
260
336
375
525
624
722
Raw Material
173
219
226
334
405
469
Personnel
29
41
53
66
81
96
Selling and Administration Expenses
48.1
65.4
96.2
-
-
-
Others Expenses
9
10
-
126
138
156
EBITDA
19
22
41
52
78
92
% chg
63.1
21.3
81.6
28.7
48.6
17.9
(% of Net Sales)
6.7
6.3
9.8
9.1
11.1
11.3
Depreciation& Amortisation
4
5
6
8
19
21
EBIT
14
17
35
44
59
71
% chg
70.7
20.0
99.9
27.4
32.7
20.5
(% of Net Sales)
5.2
4.8
8.3
7.6
8.3
8.7
Interest & other Charges
3
3
3
4
12
12
Other Income
1
1
2
1
3
3
(% of PBT)
6.5
7.4
4.6
3.2
5.1
4.9
Share in profit of Associates
-
-
-
-
-
-
Recurring PBT
12
15
33.4
41
49
61
% chg
105.9
25.2
123.1
22.9
20.4
24.2
Tax
4
5
12
14
16
20
(% of PBT)
35.2
34.1
36.4
33.6
33.0
33.0
PAT (reported)
8
10
21
27
33
41
Extraordinary Items
(0)
(1)
-
-
-
-
ADJ. PAT
8
10
21
27
33
41
% chg
55.9
34.2
103.3
28.3
21.4
24.2
(% of Net Sales)
2.8
2.9
5.1
4.7
4.7
5.0
Fully Diluted EPS (`)
3.5
4.7
9.5
12.2
14.9
18.5
% chg
55.9
34.2
103.3
28.3
21.4
24.2
August 19, 2019
4
Safari Industries|1QFY2020 Result Update
Balance Sheet
Y/E March (` cr)
FY2016 FY2017 FY2018 FY2019 FY2020E FY2021E
SOURCES OF FUNDS
Equity Share Capital
4
4
4
4
4
4
Reserves& Surplus
87
96
168
193
224
261
Shareholders Funds
91
100
173
198
228
266
Equity Share Warrants
-
-
-
-
-
-
Total Loans
58
44
54
57
60
63
Deferred Tax Liability
-
-
0
-
-
-
Total Liabilities
149
143
228
255
288
329
APPLICATION OF FUNDS
Gross Block
42
45
60
70
80
90
Less: Acc. Depreciation
18
22
28
36
56
77
Net Block
24
23
31
33
24
12
Capital Work-in-Progress
0
1
0
1
1
1
Investments/ Other NC assets
0
-
6
-
-
-
Current Assets
143
165
244
280
336
391
Inventories
76
94
123
166
194
225
Sundry Debtors
54
58
104
95
115
134
Cash
5
5
3
1
3
4
Loans & Advances
8
7
2
3
3
4
Other Assets
-
-
13
16
20
25
Current liabilities
27
54
53
64
77
80
Net Current Assets
116
110
190
217
259
311
Deferred Tax Asset
(0)
(0)
-
-
-
-
Total Assets
149
143
228
255
288
329
August 19, 2019
5
Safari Industries|1QFY2020 Result Update
Consolidated Cashflow Statement
Y/E March (` cr)
FY2016 FY2017 FY2018 FY2019 FY2020E FY2021E
Profit before tax
12
15
33
41
49
61
Depreciation
4
5
6
8
19
21
Change in Working Capital
0
0
(79)
(23)
(41)
(51)
Interest / Dividend (Net)
3
3
3
4
12
12
Direct taxes paid
(4)
(5)
(12)
(14)
(16)
(20)
Others
(28)
4
42
0
0
0
Cash Flow from Operations
(13)
22
(6)
17
24
24
(Inc.)/ Dec. in Fixed Assets
(16)
(5)
(8)
(10)
(10)
(10)
(Inc.)/ Dec. in Investments
1
(1)
0
0
0
0
Cash Flow from Investing
(15)
(6)
(8)
(10)
(10)
(10)
Issue of Equity
7
0
0
0
0
0
Inc./(Dec.) in loans
3
1
11
3
3
3
Dividend Paid (Incl. Tax)
0
(16)
(2)
(2)
(3)
(3)
Interest / Dividend (Net)
(3)
(3)
(3)
(4)
(12)
(12)
Cash Flow from Financing
29
(17)
6
(4)
(12)
(13)
Inc./(Dec.) in Cash
1
(2)
(8)
3
2
1
Opening Cash balances
3
4
5
(3)
1
3
Closing Cash balances
4
2
(3)
1
3
4
August 19, 2019
6
Safari Industries|1QFY2020 Result Update
Key Ratio
Y/E March
FY2016 FY2017 FY2018 FY2019FY2020EFY2021E
Valuation Ratio (x)
P/E (on FDEPS)
155.6
115.9
57.0
44.5
36.6
29.5
P/CEPS
141.1
111.3
60.9
46.9
31.8
26.7
P/BV
18.3
16.7
9.6
8.4
7.3
6.3
Dividend yield (%)
0.0
0.1
0.1
0.2
0.2
0.3
EV/Sales
4.5
3.5
3.0
2.2
1.8
1.6
EV/EBITDA
68.3
55.6
30.8
24.1
16.3
13.8
EV / Total Assets
8.5
8.7
5.5
5.1
4.5
3.9
Per Share Data- `
EPS (Basic)
3.5
4.7
9.5
12.2
14.9
18.5
EPS (fully diluted)
3.5
4.7
9.5
12.2
14.9
18.5
Cash EPS
5.3
6.7
12.3
16.0
23.6
28.0
DPS
0.2
0.4
0.8
1.0
1.3
1.6
Book Value
40.9
44.9
77.7
88.9
102.5
119.4
Returns (%)
ROCE
9.7
12.1
15.2
17.3
20.3
21.5
Angel ROIC (Pre-tax)
10.0
12.5
15.8
17.4
20.5
21.7
ROE
8.5
10.4
12.3
13.8
14.5
15.5
Turnover ratios (x)
Asset Turnover (Gross Block)
6.6
7.9
7.0
8.3
8.8
9.1
Inventory / Sales (days)
100
96
108
105
101
101
Receivables (days)
71
59
91
60
60
60
Payables (days)
92
141
114
114
114
112
Working capital cycle (ex-cash) (days)
80
14
85
51
47
49
Source: Company, Angel Research
August 19, 2019
7
Safari Industries|1QFY2020 Result Update
Research Team Tel: 022 - 39357800
DISCLAIMER
Angel Broking Limited (hereinafter referred to as “Angel”) is a registered Member of National Stock Exchange of India Limited, Bombay
Stock Exchange Limited and Metropolitan Stock Exchange Limited. It is also registered as a Depository Participant with CDSL and Portfolio
Manager and Investment Adviser with SEBI. It also has registration with AMFI as a Mutual Fund Distributor. Angel Broking Limited is a
registered entity with SEBI for Research Analyst in terms of SEBI (Research Analyst) Regulations, 2014 vide registration number
INH000000164. Angel or its associates has not been debarred/ suspended by SEBI or any other regulatory authority for accessing
/dealing in securities Market. Angel or its associates/analyst has not received any compensation / managed or co-managed public
offering of securities of the company covered by Analyst during the past twelve months.
This document is solely for the personal information of the recipient, and must not be singularly used as the basis of any investment
decision. Nothing in this document should be construed as investment or financial advice. Each recipient of this document should make
such investigations as they deem necessary to arrive at an independent evaluation of an investment in the securities of the companies
referred to in this document (including the merits and risks involved), and should consult their own advisors to determine the merits and
risks of such an investment.
Reports based on technical and derivative analysis center on studying charts of a stock's price movement, outstanding positions and
trading volume, as opposed to focusing on a company's fundamentals and, as such, may not match with a report on a company's
fundamentals. Investors are advised to refer the Fundamental and Technical Research Reports available on our website to evaluate the
contrary view, if any
The information in this document has been printed on the basis of publicly available information, internal data and other reliable sources
believed to be true, but we do not represent that it is accurate or complete and it should not be relied on as such, as this document is for
general guidance only. Angel Broking Limited or any of its affiliates/ group companies shall not be in any way responsible for any loss
or damage that may arise to any person from any inadvertent error in the information contained in this report. Angel Broking Limited
has not independently verified all the information contained within this document. Accordingly, we cannot testify, nor make any
representation or warranty, express or implied, to the accuracy, contents or data contained within this document. While Angel Broking
Limited endeavors to update on a reasonable basis the information discussed in this material, there may be regulatory, compliance, or
other reasons that prevent us from doing so.
This document is being supplied to you solely for your information, and its contents, information or data may not be reproduced,
redistributed or passed on, directly or indirectly.
Neither Angel Broking Limited, nor its directors, employees or affiliates shall be liable for any loss or damage that may arise from or in
connection with the use of this information.
Disclosure of Interest Statement
Safari Industries
1. Financial interest of research analyst or Angel or his Associate or his relative
No
2. Ownership of 1% or more of the stock by research analyst or Angel or associates or relatives
No
3. Served as an officer, director or employee of the company covered under Research
No
4. Broking relationship with company covered under Research
No
Ratings (Returns):
Buy (> 15%)
Accumulate (5% to 15%)
Neutral (-5 to 5%)
Reduce (-5% to -15%)
Sell (< -15%)
August 19, 2019
8